 ABSTRACT
Allocating asset budgets between maintenance and projects is often considered an art form that demands significant experience and judgement from senior management. This is because supporting historical asset information is frequently prescriptive, inconsistent in its levels of details, and often fragmented, while managing and investing in an asset portfolio is both complex and carries significant risks for the portfolio manager. A further concern is the inability of many asset information systems to adapt to asset changes as they occur naturally in use. Many data models are not readily reconfigurable, with an inability to retain history, and consequently often result in “re-inventing the wheel” concerns, as previous views and expertise are lost. This need for flexibility, adaptability and access to history is a prerequisite for an effective “plan-do-review-act” process.
Risk-based decision support tools address some of these issues but do not generally include adaptive data models or an understanding of the changes in risk because of the fluctuations in asset degradation and performance over time. More importantly, where the input data has significant uncertainty associated with it, data driven or risk-based decision support tools do not support optimising investment for whole life cost down to each maintainable item.
In this article, we posit that it is time to change from an art form that relies on impractically high standards of experience and judgement to a more scientific approach towards investment. The proposed solution addresses these issues and explores a decision support method with adaptive data modelling capabilities for efficient and effective drill-down and ease of analysis. Hereinafter referred to as “an adaptive business data model”, this solution links business goals directly to the asset life cycle in a way that was previously thought too difficult.
Why make the change?
With the publication of asset management standards ISO 55000/001/002, driven by the need for clarity and transparency from stakeholders, the requirement for information systems with the flexibility to provide a line-of-sight between the overarching Asset Management Plan predictions and goals and the individual assets in a risk and whole life context is apparent (reference ISO 55001, 7.5: “the organisation shall include consideration of the impact of quality, availability and management of information on organisational decision making”).
Further, as the available funding to renew and improve asset performance becomes more difficult to obtain, particularly in developed economies where assets tend to be of greater age, there is an increasing need to produce more for less and demonstrate that the overarching asset management plan is whole-life-cost optimal. This will drive organisations towards a more adaptive business data model and potent decision-making business process that can deal with the uncertainties in the input data, while optimising whole life cost for each maintainable item to aptly represent the trade-off between maintenance and capital programmes.
When is it best to make the needed change?
Introducing an organisation to an adaptive data modelling approach to decision-making can be done at any time. However, it is more likely to succeed if it is carried out incrementally for both the asset portfolio and the organisational structure. It also needs to be part of an overall change management programme for asset management capabilities. In such circumstances, the adaptive business data model must be complementary to the change management approach by being readily reconfigurable and adaptive, while also able to synchronise with the developing and changing organisation. However, the information system also needs to retain each vision of the adaptive business data model definition so that it is possible to trend data across all the configurations and more effectively evaluate performance against the asset management plan.
Applications of Bayesian statistics have successfully modelled each maintainable item of an asset portfolio to aptly represent whole life cost. A prior model is developed from available data, and subsequent detailed sample studies of the model’s parameters undertaken by experienced engineers are used to update the prior model, producing a more accurate dataset known as a posterior distribution for the whole population. The improvements to the whole population’s data are in relative proportion to the accuracy of the detailed sample studies.
By harnessing Bayesian statistics’ ability to distinguish between systematic and random errors, and thereby removing bias in the data, uncertainties can be reduced at the aggregate level. For example, when a financial forecast is drawn from a summation of assets, each of which has an uncertainty measured in tens of percentage points, these can be reduced to single percentage points at the aggregate level, providing forecasts of ±10% at the aggregate level for maintainable items which individually are subject to significantly greater uncertainty.
In addition, as the whole population is augmented with more information over time, for example from annual inspections, Bayesian statistics can treat these as new additional detailed studies to rapidly adapt and learn, and hence further improve data accuracy and the basis for decision-making..
Each of these elements has now been established for several years and applied to the field of asset management. Nevertheless, assembling these elements into an overall system for asset management is relatively new, but it has been supported by a number of initiatives in recent years and these have shown that a solution is deliverable.
How to tackle optimising the timing of interventions on a whole life cost basis?
As a portfolio of assets can be both extensive and complex, the adaptive business data model and decision support toolset must have the necessary capabilities to represent them. This is particularly true where the dynamics between asset systems, deterioration, performance, risks, and intervention strategies are complex. Determining the optimal solution in such a case demands an adaptive data model approach that encompasses all possible performance, deterioration, and intervention patterns.
Business experience indicates the areas of uncertainty are performance, risk, duty cycles, the environment, and variations in degradation rates even for seemingly similar assets; consequently, it is difficult to identify a single representative sample. This is further complicated by multiple repair types, for example, a sawtooth pattern of asset condition deterioration and then vertical improvement resulting from an intervention, and replacement choices for the achievement of lifecycle-optimised investment and sustainability. In such cases, Bayesian statistics uniquely provide accurate performance, deterioration and cost predictions for each maintainable item – a prerequisite for whole life cost optimisation with uncertainty in the input data. In addition, the Bayesian approach models the whole asset population against detailed sample studies undertaken by experienced engineers, and consequently does not need a large sample, unlike classical statistics – thereby providing a robust analysis for whole asset populations at an economic cost, as the predictions can be based on a relatively small sample, typically 3%.
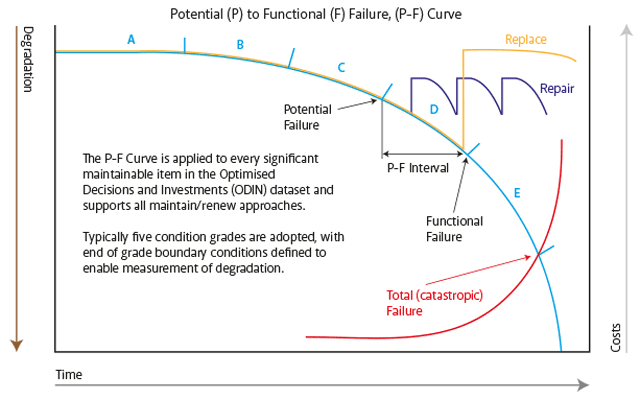
The Potential Failure to Functional Failure (P-F) curve illustrated in Figure 1 is used as a generalisation template for each maintainable item, as it is able to reflect a variety of condition changes and their links to performance states with all intervention options over time. The approach requires tracking of maintainable item condition states to performance loss along the predicted P-F curves, to identify asset intervention triggers and the economic work packages necessary to optimise whole life costs. Application of a P-F Curve is illustrated in Figure 1.

Measurement of degradation is divided into five condition grades to provide a consistent process for understanding degradation and performance loss across all asset types. These are illustrated as A, B, C, D, and E on the blue trace in Figure 1. Each condition grade has a simplified description, together with a definition of its boundary states:
A – New or as New
Newly commissioned equipment handed over to operations and maintenance. This can include refurbished equipment where it is anticipated that its life expectancy will be as new.
B – Very Good
Not new, includes refurbished equipment with lower life expectancy than new. Meets or exceeds required performance, and is maintained to a high standard with no signs of ageing or performance loss.
C – Good
Some signs of ageing while meeting or exceeding required performance, and is maintained to a reasonable standard with no signs of performance loss.
D – Fair
Signs of ageing, meets required performance on entry into this grade but has entered the P-F Curve interval where a loss of performance is possible due to age, duty cycle, environment, wear or developing defect. The P-F interval is the time from potential failure to functional failure, where the performance drops below the required specification, although total failure may still be significantly later. Functional failure at end of Grade “D” is the point at which performance drops below the required specification.
E – Poor
Visible signs of degradation in the fabric of the equipment or evidence of developing defects. May still be working reliably but with performance below specification: i.e. functional failure has already occurred in D.
How does this relate to decision support tools and data management?
The decision support toolset for asset management trade-offs between performance, cost, and risk decisions were outlined in the previous section.
As the majority of asset data has a degree of uncertainty associated with it, using deterministic approaches for whole life cost is unsuitable. However, so is using classical statistics, as this requires uneconomical sample sizes and explicit logical relationships to model the trade-off between performance, cost, and risk decisions. Explicit logical relationships are not easily identifiable to represent the uncertainties associated with real life asset behaviour and interactions. Consequently, selection of a Bayesian approach is the preferred and recommended approach, as it can support both explicit and implicit relationships to reflect real life behaviour and interactions.
All these elements have been established for several years and applied to the field of asset management. Nevertheless, assembling these elements into an overall system for asset management is a newer consideration.
The use of Bayesian statistics in asset management largely started during the privatisation of the water and later railway sectors in the late 1980s. In 2000, the Department of Trade and Industry sponsored a joint industry project called Investor, and it successfully demonstrated that it was possible to assemble these elements into an overall system. However, it also showed that using classical statistics sample sizes to evaluate deterioration patterns was uneconomical.
In the light of this, Metronet and later Transport for London developed a system that built on the Investor experience, by adopting a Bayesian approach for their ESTEEM (Engineering Strategy for Economic and Efficient Management) project.
The ESTEEM methodology was awarded the 2010 IET Innovation Award in the Asset Management category by the Institution of Engineering and Technology. It used causal links between condition and performance to make possible a holistic approach to business performance, and evaluation of risk within a whole life cost framework.
In 2012, Jacobs, ARHD Consultancy, and Professor Tony O’Hagan formed a collaboration to create a generic version called Optimised Decisions & Investments (ODIN), applicable to all asset types in asset-intensive industries.
It is a combination of a data warehouse or store and statistical simulation engine. The data in the data store is taken into a Bayesian estimator and produces revised estimates that are returned to the data store, which is then used in scenario modelling. This also means that ODIN has a self-learning capability and so can become highly representative more rapidly than standard statistical approaches over less time.
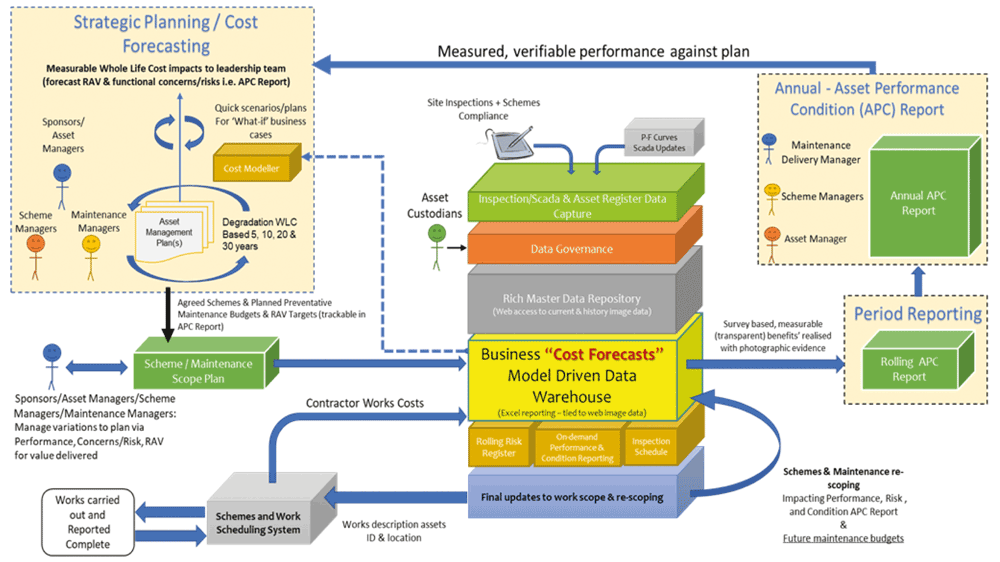
For the initial installation, as illustrated in Figure 2, an agile approach is used for the application of Bayesian principles within the adaptive business data model and the decision support toolset, to ensure system operability, and adaptability to change.
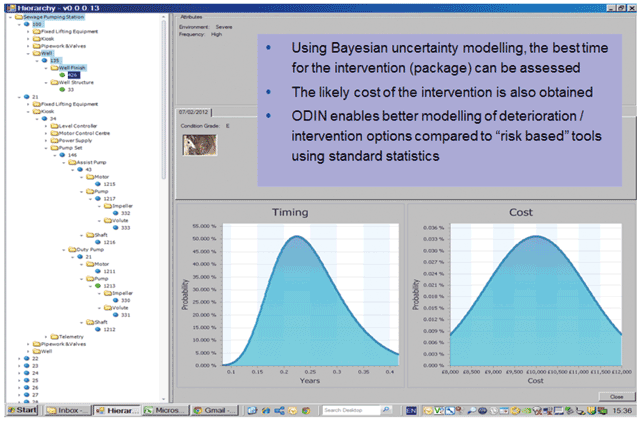
Reporting is via standard web browsers or spreadsheet applications and works with legacy information systems using key data extraction and mapping methods, as illustrated in Figure 3.


As stated earlier, a primary requirement is the development of an adaptive business data model for an organisation’s asset management function that is both representative of current requirements and maintains history to support the decision-making process of the organisation over time. This demands a high degree of configuration flexibility that can be readily re-configured with changing circumstances. The governance features of the application are also important to ensure data currency and integrity. These data management capabilities are available from ODIN, or can be supplied separately from several vendors. It is therefore feasible to provide an evolutionary asset management decision support environment to meet the modelling and reporting requirements for whole life cost investment optimisation.
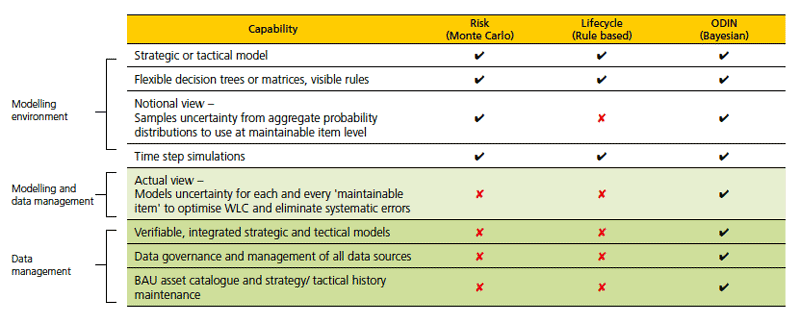
Figure 4 shows a comparison between risk-based approaches using Monte Carlo simulation; lifecycle assessment using a rules-based approach; or ODIN, using Bayesian modelling and agile data management approaches.

Who should be involved in the change?
As with many aspects of asset management, finding the better solution requires a multi-disciplinary approach. To ensure this is an agile change that fits within the organisation, it also needs to be based on an incremental approach where an earlier step warrants each subsequent step. Based on previous experience, a small team is recommended with the requisite experts in the subject matter, such as defining decision support requirements, business data models, and decision support tools (Bayesian analysis), and led by asset management specialists to minimise cost and risks to the business.
Conclusions
The variety of potential options for an overarching asset management plan – for example continue as is, critical parts rebuild, extensive refurbishment, complete replacement – all need to be ranked on a common basis of performance, cost, and risk, to make the appropriate comparison and selection for whole life cost investment optimisation.
All asset-intensive business sectors, such as refining, petrochemicals and rail, have opportunities to deploy such methodologies and utilise data more effectively.
This is a challenging approach for many asset owners as they do not have the variety of models for asset deterioration, failure, whole life cost, and risk, readily at hand or integrated together. It is also true that with such a shortfall, effective data gathering and standardisation of data for use with these models is lacking. To assist asset owners with this predicament, a series of projects have been undertaken: Investor, ESTEEM, and now ODIN.
ODIN is a top-down and bottom-up whole life cost analytics tool that models investment strategies and policies, and each maintainable item and its uncertainty, usingBayesian statistics, to provide line of sight and verification between top-down investment policies and what happens on the ground. ODIN has been designed as a generic solution for mechanical & electrical and process plant, and is potentially extendable to linear assets such as pipelines, power distribution, rail and highways. This has required degradation predictions and intervention cycles to be structured to reflect a broader range of linked performance and condition states.
These projects and their proven and developing methodologies for optimising investments in assets are based on low cost sampling techniques that are compliant with ISO 55000. They have evolved and been refined over a period in excess of 25 years, to meet developing asset management needs and requirements.
Such an approach has the potential to transform the accepted processes, strategies and management, in other words to be a “game changer” for asset owners with a large portfolio of assets and uncertainty in their input data.
Authors’ Biographies

Director of Bayesian Statistics, ARHD Consultancy and Emeritus Professor of Statistics, Sheffield University

Darbyshire,
Director of Asset Management Strategy, ARHD Consultancy

J Geake,
Senior Asset Management Consultant at Jacobs Consultancy
Dr Peter J Geake is a Senior Asset Management Consultant at Jacobs Consultancy, John Darbyshire is Director of Asset Management Strategy at ARHD Consultancy and Professor Tony O’Hagan is Director of Bayesian Statistics, ARHD Consultancy and Emeritus Professor of Statistics in the School of Mathematics and Statistics at the University of Sheffield.
Jacobs Consultancy is part of Jacobs, the global professional services provider, and is leading a collaboration with ARHD Consultancy and Professor Tony O’Hagan, to transfer previous work on asset management decision support tools to asset-intensive industries.
ARHD Consultancy has led a number of modelling and engineering studies in rail over the last 10 years and currently supports the Transport for London ESTEEM Whole Life Cost project. ARHD Consultancy has been involved in designing, delivering and supporting asset information, whole life costing and Bayesian statistical modelling systems since 2007.
Professor Tony O’Hagan led the Bayesian modelling design and build for the ESTEEM project.

